Cadence
Visualizing years of training history.
Overview
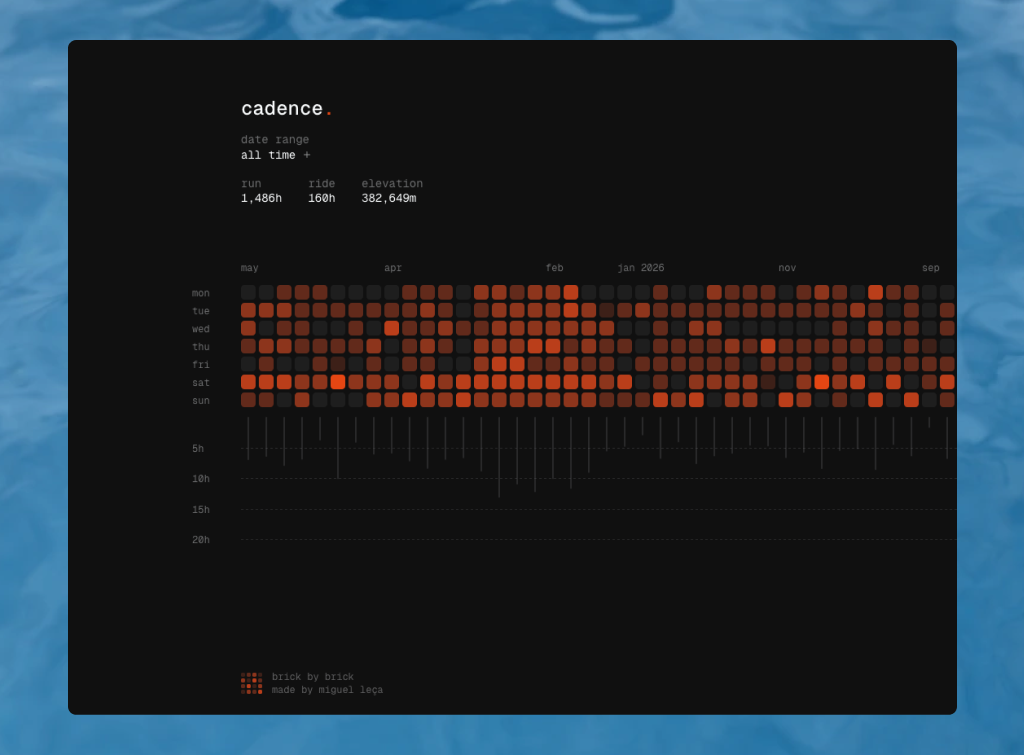
I built Cadence as a way to zoom out and visualize my training. The consistent weeks, the gaps, the bigger blocks, and the quiet stretches over time. It turns years of running and cycling data into a long-term training view, heavily inspired by GitHub's contributions graph.
The name felt right because cadence is about rhythm. The consistency of showing up, built on weeks upon weeks, months upon months, years upon years.
brick by brick
Strava
I started with a bulk export of my past Strava activities. After that, new weeks are added automatically through the Strava API.
Every Monday, a Vercel cron job pulls the previous week's activities and updates the visualization, so the page stays current without me having to touch it.